Tangram House Flushing (Photo: F&T Group)
July 18, 2023 By Czarinna Andres
A new report has highlighted a drop in new development sales volume in Queens, contrasting with rising contract prices in the borough.
The recent Q2 2023 analysis by Brown Harris Stevens Development Marketing (BHSDM) Research & Advisory division indicates a 31% decrease in new development contracts signed compared to Q1, with 128 signed contracts in Q2 against 186 in Q1.
However, the report also notes an increase in the average contract price based on the last asking price in the borough. In Q2 2023, the average new development contract-signed price rose by 23% to $1,026,802 from Q1’s figure of $831,121. This marks a significant year-on-year increase, rising 24% from the Q2 2022 figure of $828,487.
The average price per square foot also saw a considerable increase, up 16% from Q1 2023 ($1,147) to $1,333 in Q2 2023. Compared to Q2 2022 ($1,092), this represents a 22% rise.
The analysis pointed out that the average size of units that went into contract in Q2 2023 was nearly identical to the average size of a unit on the market, at 771 square feet versus 797 square feet, respectively.
The most expensive contract signed in the quarter was PH2A at Tangram House South in Flushing, last listed for $3,020,253, while the most expensive contract price per square foot was unit 5807 at 3 Court Square in Long Island City, listed for $2,000 per square foot.
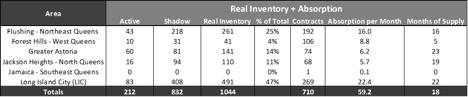
Graph provided by the Brown Harris Stevens Development Marketing (BHSDM) Research & Advisory division
The study also pointed to a new wave of residential development in Queens. In Q2, 146 new units were added across two buildings. The largest of these is the Nusun Tower at 136-18 Maple Ave. in Flushing, which added 113 units.
In terms of activity, Long Island City was the most active neighborhood with 85 contracts signed. The most active building in the borough was 45-30 Pearson St., also in Long Island City, with 33 contracts signed.
Overall, Queens’ new development, which comprises units actively marketed and shadow inventory not yet released, totaled 1,044 units. With an average of 59 sales per month over the past 12 months, this suggests the borough has approximately 18 months of supply, up from 13 months in Q1 2023 and 12 months in Q4 2022.
This drop in sales volume in Queens diverges from trends seen in Manhattan, where the volume of sales for new developments increased in Q2 2023, according to the same BHSDM analysis.
Conversely, both Queens and Brooklyn experienced downturns in new development sales volume during this period.
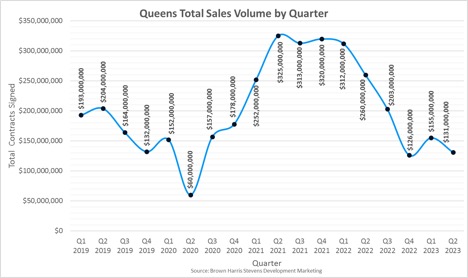
Graph provided by the Brown Harris Stevens Development Marketing (BHSDM) Research & Advisory division
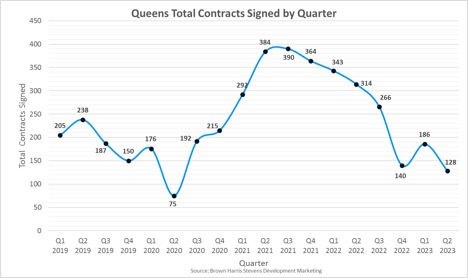
Graph provided by the Brown Harris Stevens Development Marketing (BHSDM) Research & Advisory division
